Apropos of the Nicholas Carr reading for Thursday, our data conversation today, and the data viz assignment coming up, it seems worthwhile to pass along a post I just saw about children and marshmallows. Are you familiar with the famous marshmallow test? Children are brought into a room and given a marshmallow, but with the instruction that if they choose to wait to eat it for a little while, they can then eat it and a second marshmallow. Researchers found a pretty high correlation between the ability of children to delay gratification and to go on to academic and other life successes later.
These studies have been repeated with variations lots of times since it was first conducted in the late 1960s. A recent new version of this study began with polling a range of experts, asking them whether children are getting worse or better at delaying gratification now. 84% of the 260 experts “believed kids these days are getting worse or are no different. Contrary to this prediction, kids these days are better able to delay gratification than they were in the past, corresponding to a fifth of a standard deviation increase in ability per decade.” Here’s the meta-regression chart showing changes in the ability of children to delay gratification over the past 50 years on the marshmallow test, conditioning on age that they provide in the study:

These researchers show that over the last five decades, kids have been able to delay gratification for almost twice as long (from 5 minutes to 10 minutes).
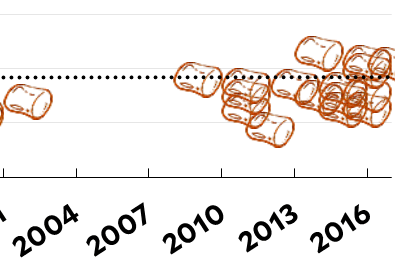
However, Kevin Drum at Mother Jones takes a look at that chart and notices that the first three studies on their chart all showed much lower wait times than any study after them. What if a peer reviewer were to look into those first three studies and find that they aren’t fully reliable? Maybe “those first three tests weren’t done all that rigorously since the test was brand new and researchers hadn’t yet figured out all the possible cues that could screw it up,” Drum posits. So, Drum removes those first three tests and creates a new meta-regression analysis of all the other studies, and that graphic tells a very different story:
If the chart starts in 1971 instead of 1967, then it shows a completely flat trend line, with students waiting on average 9 minutes to eat their marshmallows. The first 3 results, from 5 decades ago, are responsible for the entire increase that these researchers are pointing to as a way of arguing that 218 of the 260 experts they polled on the question whether kids are getting better or worse are wrong.
It’s important to be careful in managing and representing information like this. You won’t have this exact problem for your data visualizations because your start and end points are pretty much set and you probably won’t be using full on means-regression analyses. However, you will likely need to make decisions about how to handle outliers in your data and how to decide what counts as “average.” If you measure how friendly you are for a week and then have a migraine for two days during your data collection period and spend that time in pain, maybe in bed, then how do you handle that in your analysis? If you hug 10 people every day for the non-migraine days, then nobody when you are sick, does that mean you averaged 7 hugs per day? Or does it mean that you averaged 10 hugs per day, with two days that don’t count? Or something else?
Your data sets will be messy enough and disparate enough that I can’t give you blanket clear cut rules for how to go about answering these questions. Make the best judgment calls you can — which might entail asking Katie, your peers, or me for advice — but then explain in your reflection what sorts of decisions defined your work and how you went about making those decisions. Try to make your thought process visible to the rest of the class.